Tracing NYCHA: READING CRIME
TRACING CRIME
PLANNING
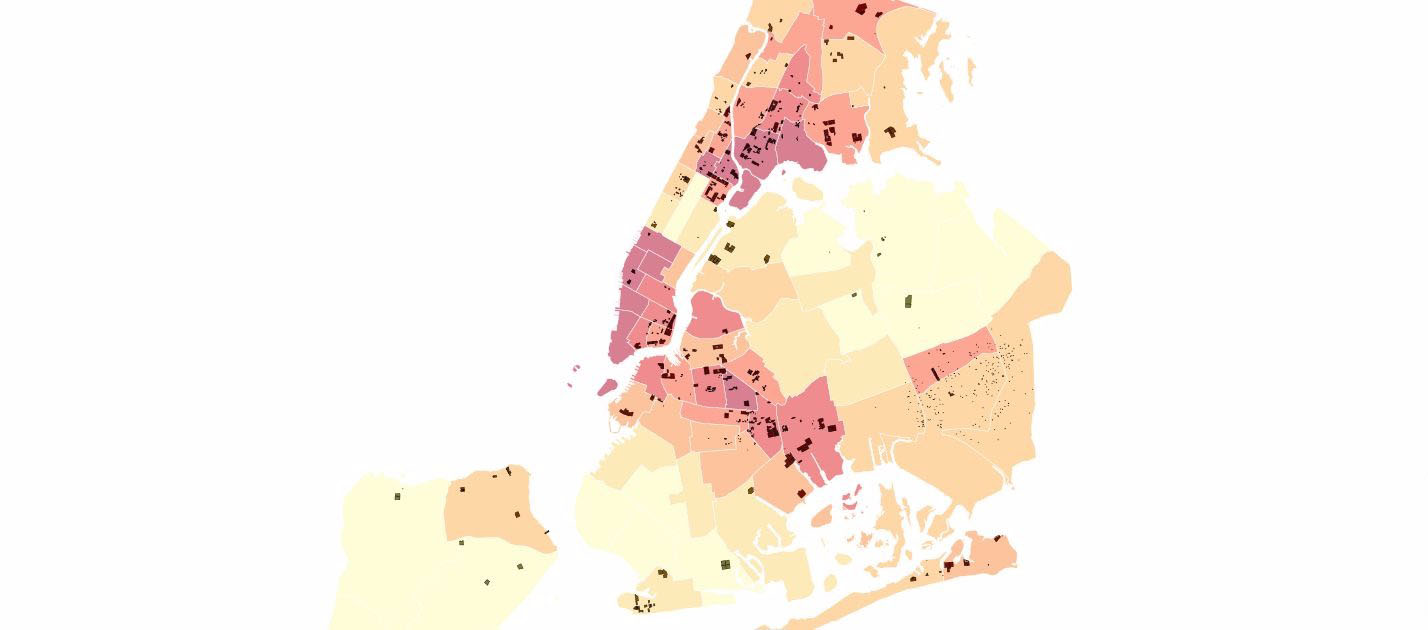
This map seeks to investigate the relationships between crime and public housing in New York City. It is the predecessor of the next project, which introduces the site typologies within each NYCHA property.
Users can hover over the map to discover the rate of crime per 1000 persons.
The gradient shows the density of crime. The following slideshow exhibits frames which show an abstract plan of NYCHA properties in NYC, the safe zones of NYC and the crime ridden zones in NYC.